

Kardex tracks headcount, costs and investments across the region in a single Power BI report.
For Kardex's regional controlling, a Power BI cost center report brings headcount, SAP costs and investments into one place. Each manager has access only to the cost centers they are responsible for.
Business need
Regional controlling tracked headcount, costs, investments and cost per employee by cost center, across several countries. The data sat in separate files, exported from different systems.
Costs came from an SAP export, the employee list and open positions from HR, investments from the yearly CAPEX lists, and the cost center mapping was kept separately for each country.
Result
Headcount, costs and investments across the region are analysed in a single report, with the same filters by country, function and cost center. The report refreshes from the sources uploaded to SharePoint, and access follows cost center responsibility.
Solution delivered
- Four indicators at the top of the reportHeadcount (FTE), cost, investments (CAPEX) and cost per employee, recalculated for the selected filters.
- Drill-down on each indicatorOpen positions, monthly headcount and the employee list; cost types and the monthly trend; investments by asset category and the detailed list.
- Filters that follow the company structureYear, country, function, cost center, cost center owner, COGS or OPEX.
- Connected sourcesThe SAP cost export, the employee and open position lists, the yearly CAPEX lists and the cost center mapping, in a SharePoint library.
- Access by responsibilityRow-level security based on the signed-in user. A manager has access only to the employees and cost centers they are responsible for; regional finance has access to all the data.
- Kardex branding and the guidesThe report follows the Kardex corporate design guide. The deployment and maintenance guides cover the sources, the refresh and adding users.
How it works
- 01
The sources
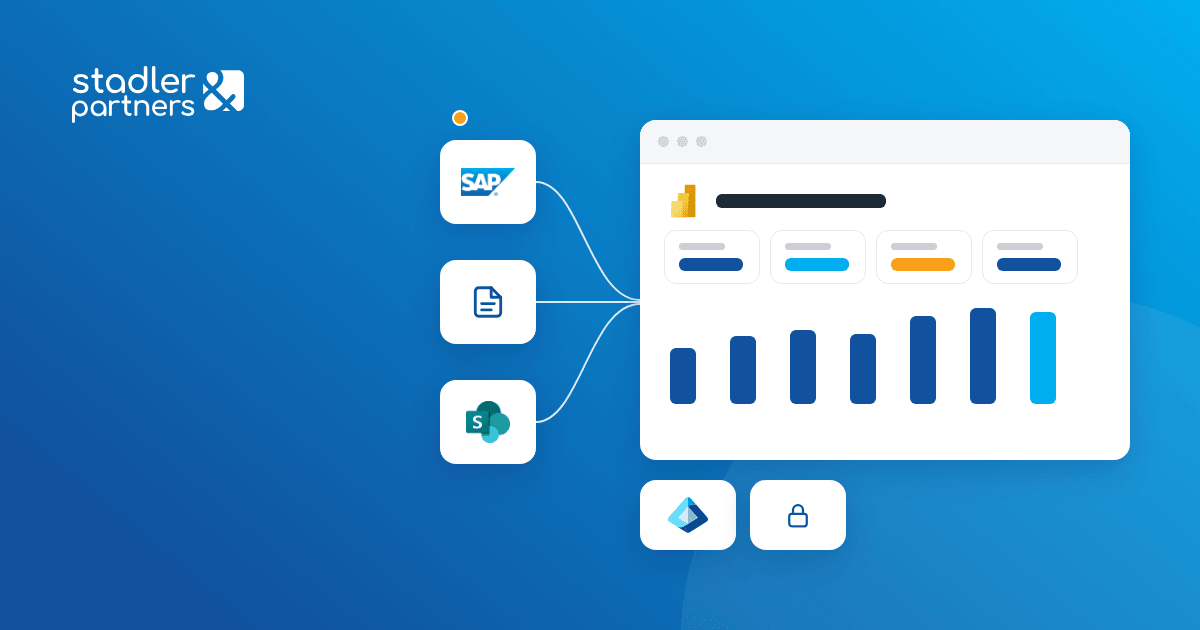
The SAP exports and the HR and CAPEX lists are uploaded to a SharePoint library.
 SAP
 Excel
 SharePoint
- 02
The model
Power BI links costs, headcount and investments through the cost center mapping.
 Power BI
- 03
Access
A Microsoft Entra security group grants access to the report, and the roles filter the rows by user.
 Microsoft Entra
- 04
The report
Finance and the managers analyse the indicators and the detail, filtered by the company structure.
- Power BI