


Your data, visible. Your decisions, informed.
Sales, costs, inventory, cash flow — Power BI connects your data sources and transforms them into clear reports, accessible anytime, from any device.
Learn more
Power BI connects data from your ERP, Excel, CRM, or other systems and displays it in one place, updated automatically. Instead of waiting for manual reports or reconciling files, you have the correct figures available in real time — for you and your team.
What reports can you track with Power BI?
Regardless of department — Finance, Sales, Logistics, or Projects — Power BI consolidates the relevant data in one place and displays it up to date, without manual reports.
Management / Finance
Revenue vs. target, operating margin, cash flow evolution. A clear picture of financial health, without waiting for the monthly accounting report.
Sales
Performance by representative, region, or product. Forecast vs. actual. Conversion rate. See immediately where you're winning and where you're losing.
Logistics & Inventory
Stock turnover, order accuracy, average processing time. Detect bottlenecks before they become problems.
Projects & Resources
Projects delivered on time, estimated budget vs. actual cost, team utilization rate. Concrete data for discussions with clients and management.
What you can do with Power BI — simply and visually

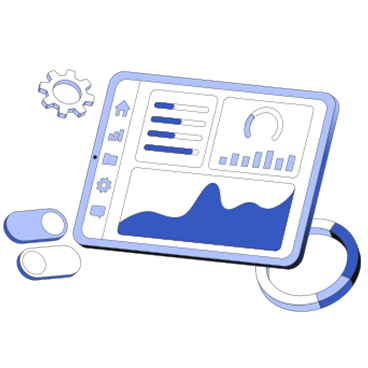
Interactive dashboards
Each department has its own dashboard, updated automatically. Managers see the numbers that matter to them, without requesting reports from anyone.

Relevant charts and visualizations
From simple charts to complex visualizations — Power BI transforms columns of numbers into information you understand at a glance.

Intuitive interface
Filter, explore, and correlate data with just a few clicks. No technical background is needed to use the delivered reports.
Artificial intelligence analytics
Power BI automatically identifies trends, anomalies, and forecasts — and alerts you when something deserves attention, before you spot it manually.
Your first report delivered in just a few weeks
Stadler & Partners connects your existing data sources — ERP, Excel, CRM — and builds the reports you need. Not generic consulting, but concrete implementation, with the indicators relevant to your business and post go-live support.
Learn more

Which Power BI plan is right for you?
Choose based on how you want to share and use reports within your organization
| Features | Power BI Desktop | Power BI Pro | Power BI Premium |
|---|---|---|---|
| Free | |||
| Included in Microsoft 365 E5 package | |||
| Per user licenses | |||
| Report sharing | |||
| Export to CSV, PDF, XLS | |||
| Reports embedded in other applications | |||
| Access to Microsoft Fabric |
Frequently asked questions

What are the benefits of Power BI for my business?
You replace manual Excel reports with automatically updated dashboards. Managers have the correct figures available at any time, teams work with the same data, and decisions are made based on reality — not the last file sent by email.
How is Power BI different from Excel?
Excel is a calculation tool. Power BI is an analysis tool: it connects large volumes of data from multiple sources, updates them automatically, and allows interactive exploration of information — without fragile formulas and without manual reconciliations.
How much does Power BI cost?
There are three options: Desktop (free, for individual use), Pro (included in Microsoft 365 E5 or available per user), and Premium (for large volumes and advanced features). Contact us for an assessment of what you already have included in your existing Microsoft licenses.
Can I connect Power BI to non-Microsoft systems?
Yes. Power BI has over 270 native connectors — SAP, Oracle, Google Analytics, Salesforce, Amazon, and many others. If a system exists, there is almost certainly a connector for it. The full list is available in the Power BI connector library.
Is Power BI also suitable for small businesses?
Yes. Many of our clients are companies with 15–80 employees who had their reporting in Excel and wanted to see their figures in real time, without an internal IT department. Power BI Desktop is free — the real cost is the implementation, not the license.

