

ITU's activity across its Member States, from programme down to project, in a single report.
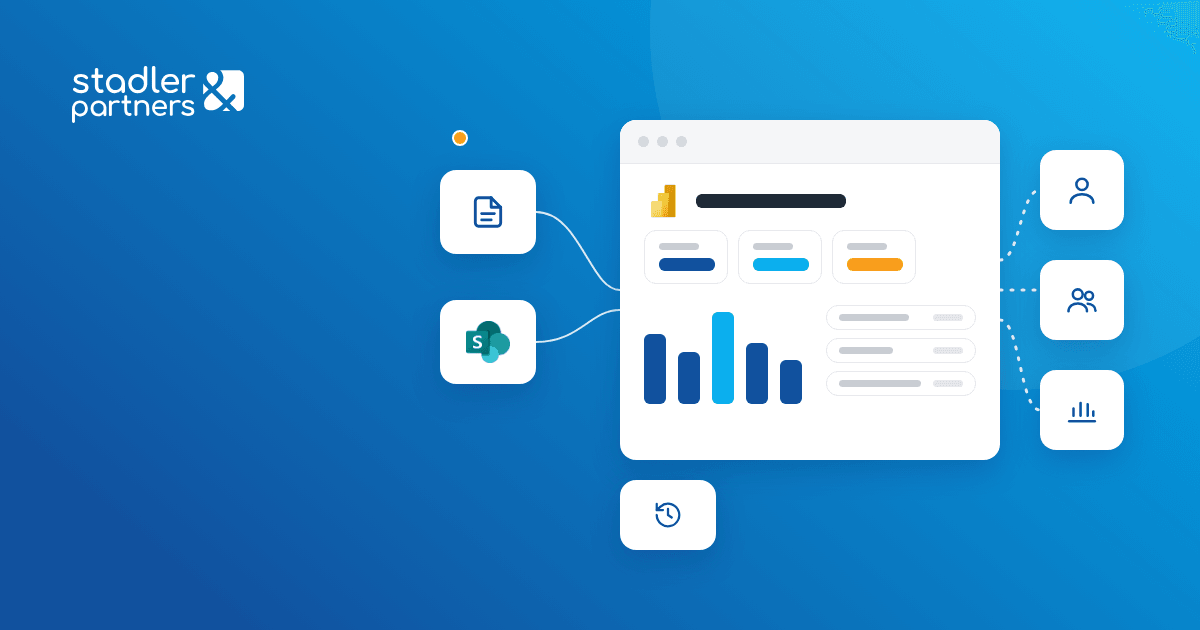
ITU's project portfolio across Member States, with partners, funding sources and programmes, is reported from one Power BI data model. Management, programme teams and Member States consult the same data.
Business need
The organisation runs development projects in its Member States, with different partners and funding sources, grouped by programme and activity type. Projects were tracked in a spreadsheet register maintained by the programme teams.
Every report to management or to a Member State meant consolidating the register by hand. The same questions came back each time, from the projects in a region to their partners and funding, down to the stage of each project.
Result
The organisation's operational activity, excluding accounting, is reported in a single Power BI report, on the same dimensions for every user. For any region, country, partner or programme, the report shows which projects are running, how they are funded and what stage they are at. Data refreshes on a schedule from the register in SharePoint.
Solution delivered
- One data model for the whole portfolioProjects, countries, partners, funding sources and programmes, linked in a single model. Duration, stage and performance indicators are calculated in the Power BI model.
- The overall picturePortfolio indicators at organisation level, recalculated by year, region, partner or programme.
- From region to Member StateActivity by region, with drill-down to each country and, from there, to the project.
- Partners and fundingWhich projects each partner supports and which sources fund each programme.
- Programmes and activity typesThe portfolio grouped by programme and activity type, for planning and programme reporting.
- The project recordThe full data of a project, opened directly from any view of the report.
How it works
- 01
The register
Programme teams update the project register in a SharePoint library.
 Excel
 SharePoint
- 02
The model
Power BI normalises the register and calculates the indicators by project, country, partner and programme.
 Power BI
- 03
The refresh
The report refreshes on a schedule from the SharePoint library, with no manual exports.
- Power BI
- SharePoint
- 04
The reporting
Management, programme teams and Member States analyse the same activity, from the overview down to the project.
- Power BI